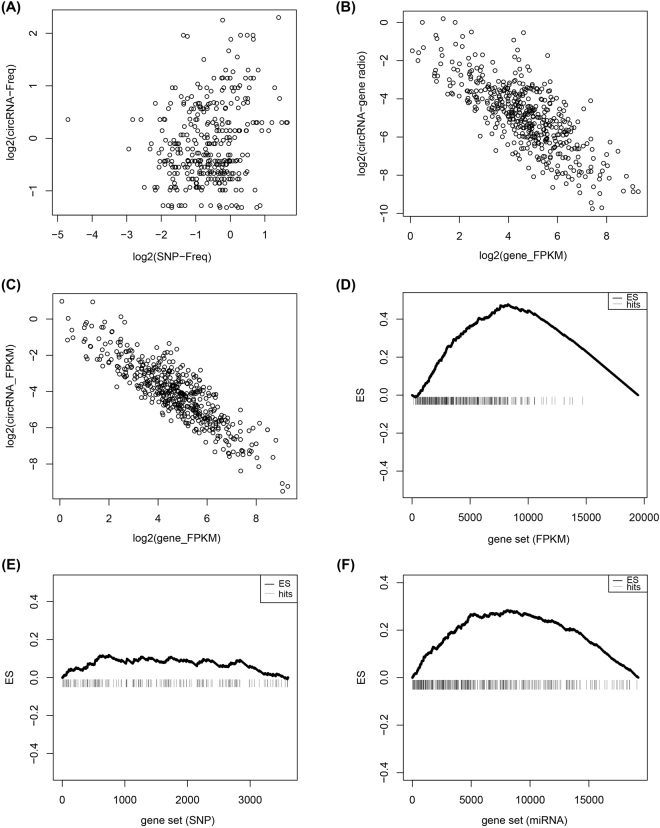
Figure 2.
Different degrees of enrichment of expression between circRNAs and their host genes in 38 single cells. (A) Correlation analysis for circRNA-Freq and SNP-Freq in 38 single-cell samples; (B) Correlation of circRNA-gene ratio and host gene FPKM; (C) A negative correlation between expression of circRNAs and host genes; (D) The expressed enrichment of circRNA host genes. (E) The random distribution of circRNA host genes within the sorted list who contained all the genes with SNPs. (F) The enrichment of circRNA host genes sorted by counts of miRNA. The horizontal axes in (E), (D) and (F) represent gene list with expressed gene, SNPs and miRNAs, respectively. And they were ordered by expression level, counts of SNPs and counts of miRNA sites from high to low, respectively. Vertical bars represent the location of circRNA host genes within the sorted lists. The ES values were the maximum deviation from zero encountered in the random walk. The upper curves represent the dynamic ES value.

