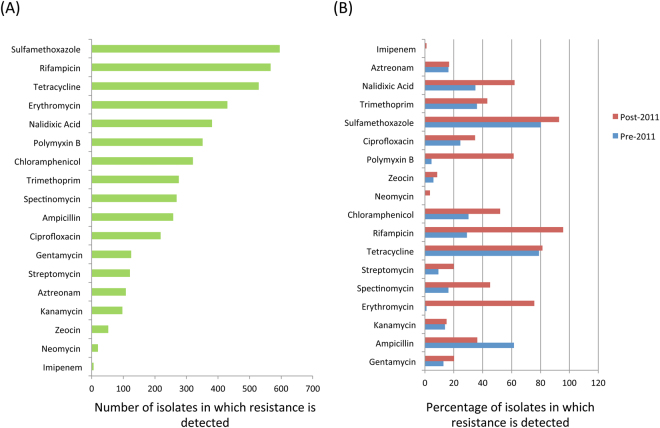
Figure 2.
(A) Number of isolates in which resistance is detected for each antibiotic. (B) Detection percentages of resistance to each antibiotic, detected in pre and post 2011. Besides providing an illustration of the pattern of antibiotic resistances across all MDR isolates, the figure also highlights the rise in resistance to certain antibiotics. In contrast, the resistance to ampicillin (a legacy antibiotic) is observed to have decreased post 2011. Many of these trends correlate with the usage of various antibiotics analyzed in previous studies.

