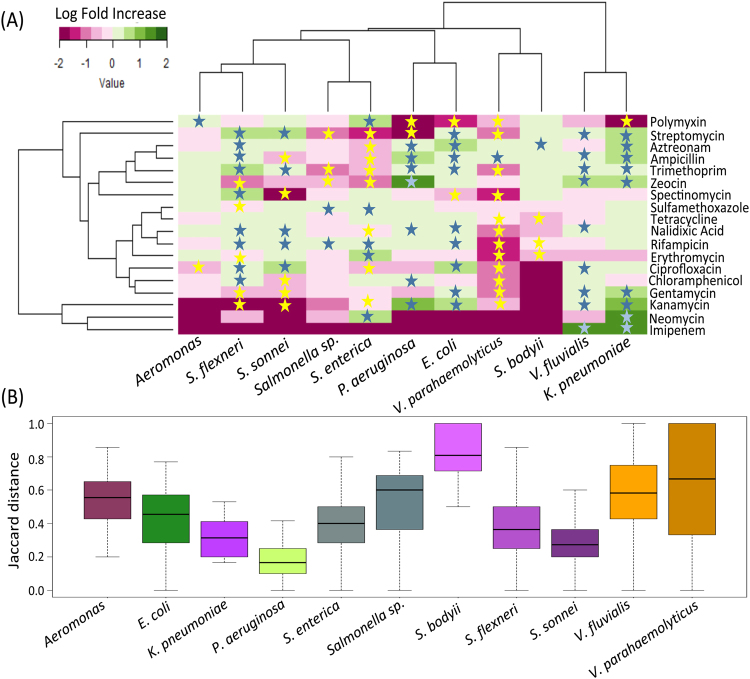
Figure 3.
(A) Log fold change in the resistance detection to various antibiotics in each of the pathogens (as compared to all others). Only species with more than one isolates (detected in the current study) were included in this analysis. While antibiotics against which resistances are significantly high and significantly low (in the different pathogens) are indicated in blue and yellow stars, respectively. (B) Variation of pairwise Jaccard distances between the resistance profiles of the isolates belonging to the various pathogens. Different species are not only observed to have distinct resistance patterns, but the isolates within species are also observed to vary to different extents in their resistance profiles.

