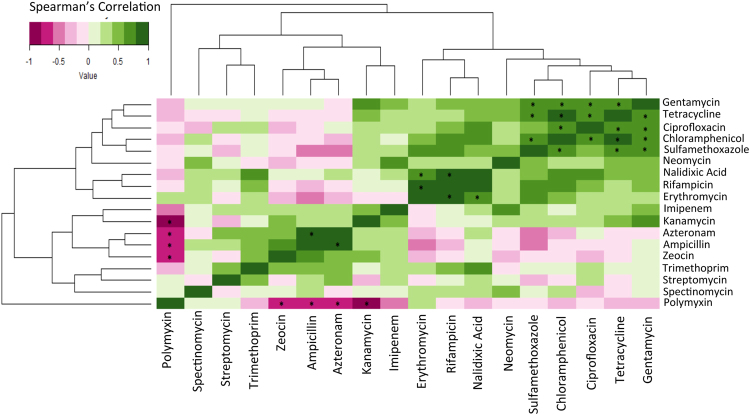
Figure 4.
Correlation in the resistance trends of various antibiotics. The figure indicates groups of antibiotic that have similar patterns of resistances across the 11 different pathogens, for which more than 1 isolates were detected in the current study. Two species, P. stuartii and S. dysenteriae, which contained just one isolate were not included in the statistical/association analyses. Correlations with P-value of less than 0.10 corrected for multiple comparisons using Benjamini-Hochberg procedure are highlighted using*.

