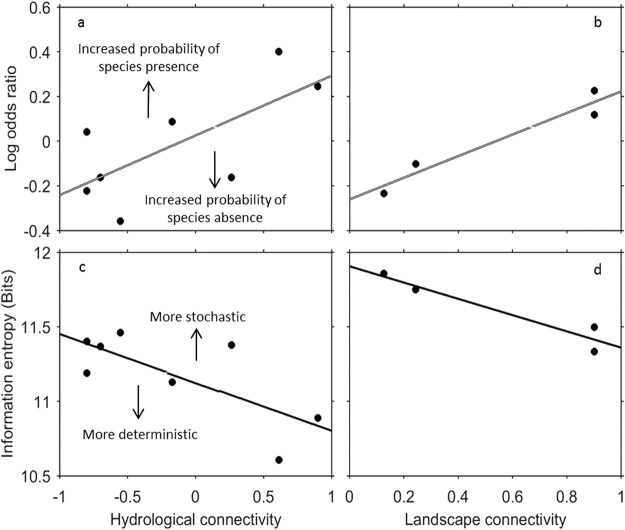
Figure 1.
(a) Linear regression for log odds ratio (effect of sampling date) and standardised hydrological connectivity, R 2 = 0.49, P = 0.05. (b) Linear regression for odds ratio (effect of waterhole) and landscape connectivity, R 2 = 0.90, P = 0.05. (c) Linear regression for community entropy (mean for all waterholes) and standardised hydrological connectivity, R 2 = 0.53, P = 0.04. (d) Linear regression for community entropy (mean for all waterholes) and landscape connectivity, R 2 = 0.83, P = 0.09.

