Fig. 1.
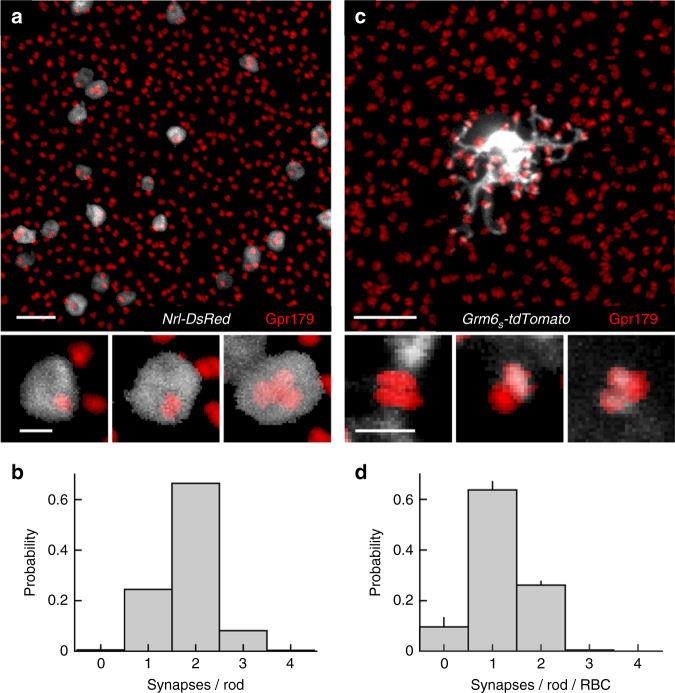
Rod-RBC synapses exist in different configurations. a Maximum intensity projection of a confocal image stack of the outer plexiform layer of a retina, in which rods were electroporated with Nrl-DsRed (gray) and in which RBC postsynaptic sites were stained for Gpr179 (red). Scale bar represents 5 μm. The top panel shows an overview, whereas the bottom panels present higher magnification views of individual rod spherules. b Histogram of the number of Gpr179 clusters per rod observed in our data (n = 555 rods, n = 12 mice). Scale bar represents 0.5 μm. c Analogous to a, but showing AAV-mediated (Grm6 S -tdTomato) labeling of an individual RBC in gray. For visual clarity, the RBC and rod synapses were digitally isolated in Amira. d Population data (mean ± SEM) showing the distribution of postsynaptic densities assembled by each RBC per rod spherule (n = 29 RBCs, n = 8 mice)

