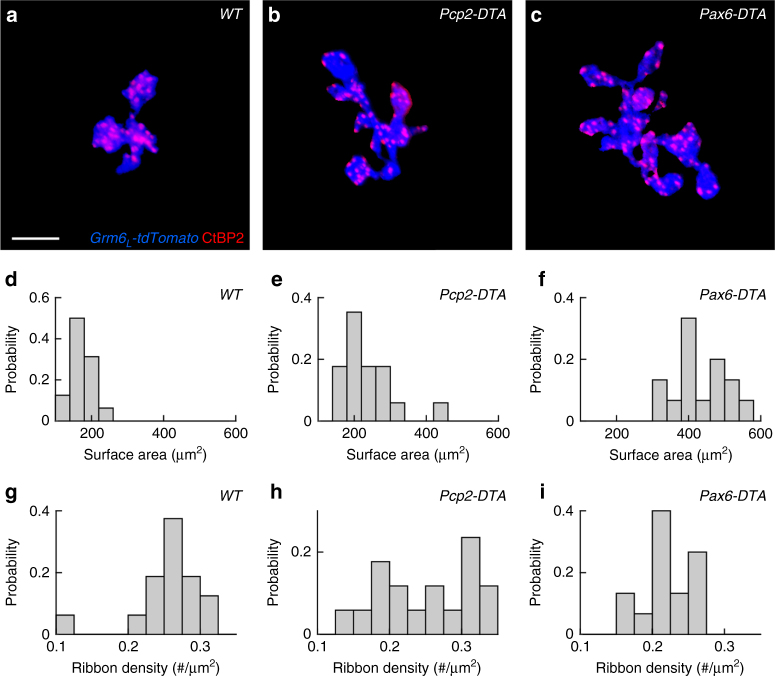
Fig. 6.
Cell density regulates RBC axon and synapse development. a–c Maximum intensity projection of RBC axon terminals labeled by transgenic expression of tdTomato (Grm6 L -tdTomato in blue) and presynaptic release sites stained for the C-terminal binding protein 2 (CtBP2, red) in wild-type (a), Pcp2-DTA (b), and Pax6-DTA (c) retinas. For visual clarity, RBC axons and their synapses were digitally isolated in Amira. Scale bar indicates 5 μm. d–f Summary data of RBC axon surface areas in wild-type (d, n = 16 RBCs), Pcp2-DTA (e, n = 17 RBCs), and Pax6-DTA (f, n = 15 RBCs) mice. By Kruskal–Wallis one-way ANOVA testing, RBC axon surface areas in Pcp2-DTA and Pax6-DTA retinas were greater than in wild-type retinas (p < 0.02 and p < 10−8, respectively), and RBC axon surface areas were greater in Pax6-DTA than in Pcp2-DTA retinas (p < 0.003). g–i Population data (mean ± SEM) from wild-type (g, n = 16 RBCs), Pcp2-DTA (h, n = 17 RBCs), and Pax6-DTA (i, n = 15 RBCs) retinas show that synapse density tends to decrease with increasing axon size. By Kruskal–Wallis one-way ANOVA testing, RBC synapse densities in Pcp2-DTA and Pax6-DTA retinas were lower than in wild-type retinas (p < 0.003 and p < 0.02, respectively)

