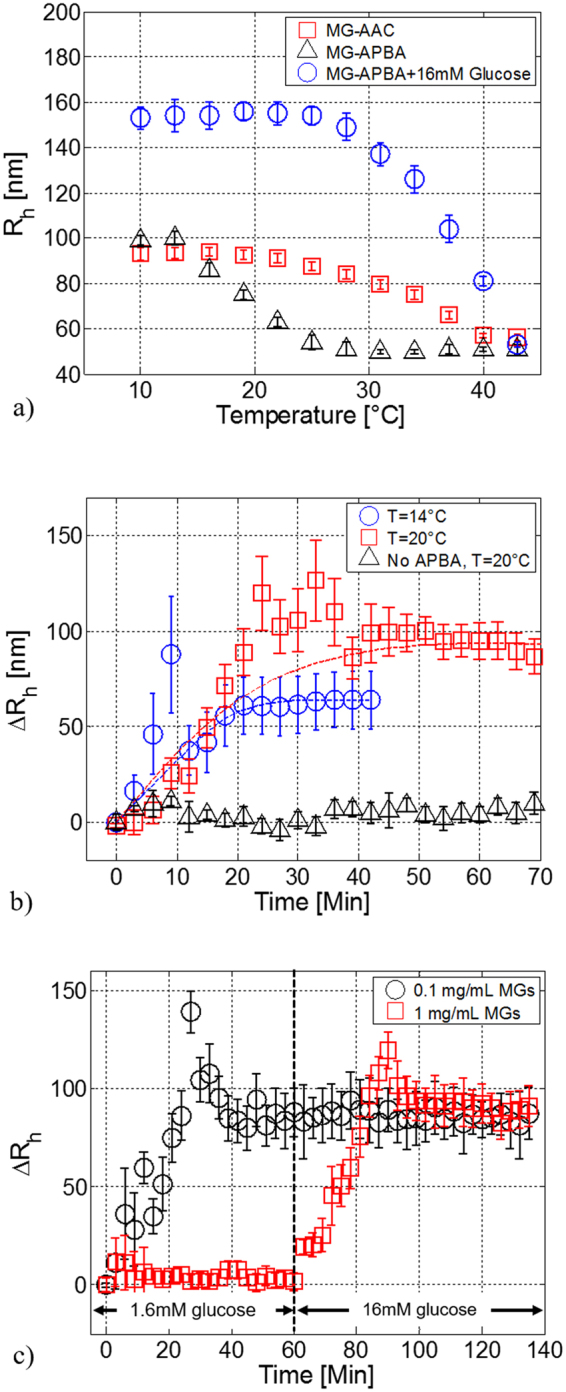
Figure 2.

DLS measurements of functionalized MGs. Hydrodynamic radius (Rh) of the native (pNIPAm-co-AAc) MGs (red squares) and functionalized (pNIPAm-APBA) MGs before (black triangles) and after glucose binding (blue circles) as a function of temperature (a), Rh variations (Rh - R0) of the (pNIPAm-APBA) MGs as function of time during glucose binding at 16 mM, for temperatures of 14 (blue) and 20 °C (red), black triangles curve represents Rh variations for not functionalized MGs (negative control) (b). Rh variations as a function of time for MGs concentration of 1 mg/mL and 0.1 mg/mL for glucose concentrations of 16 mM and 1.6 mM at 20 °C (c).
