
Figure 1. Light‐evoked cfcEPSCs in large CbN neurons change during postnatal development.
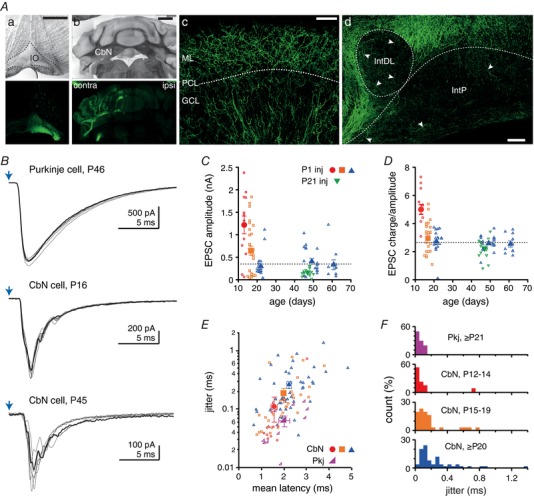
A, coronal sections of the brainstem (Aa) and cerebellum (Aa–Ad) after viral injection into the IO. Aa and Ab, Expression in IO neurons results in anterograde labelling of climbing fibres (CFs) in the contralateral cerebellum (top, differential interference contrast; bottom, Z‐stacks of confocal images). Ac, Z‐stacks of confocal images showing labelled CFs in the cerebellar cortex. ML, molecular layer. PCL, Purkinje cell layer. GCL, granule cell layer. Ad, Z‐stacks of confocal images showing climbing fibre collaterals (arrowheads) in the posterior interpositus nucleus (IntP) and the dorsolateral horn of the interpositus nucleus (intDL). Scale bars: (Aa) 500 μm, (Ab) 1 mm, (Ac) 50 μm and (Ad) 100 μm. B, light‐evoked EPSCs in a Purkinje cell (cfEPSCs, top) and CbN neurons at different ages (cfcEPSC, middle and bottom). Purkinje cell cfEPSCs were recorded in the presence of 5 μM DNQX. One example trace of six is highlighted. Blue arrow, stimulation time. C, maximal cfcEPSC amplitude vs. age in CbN cells. After P1 injection: red circles, P12–14; orange squares, P15–19; blue triangles, P20–62. After P21 injection: green triangles, P44–50. Filled symbols are mean data. Dashed line, steady‐state amplitude in adults. D, cfcEPSC charge over amplitude ratio vs. age. Same symbols as in (C). E, EPSC jitter (SD latency) vs. EPSC mean latency in CbN neurons at various ages (symbols as in C) and Purkinje cells (≥ P21, magenta right triangle). F, distribution of EPSC jitter in CbN neurons and Purkinje cells. Same data as in (E).