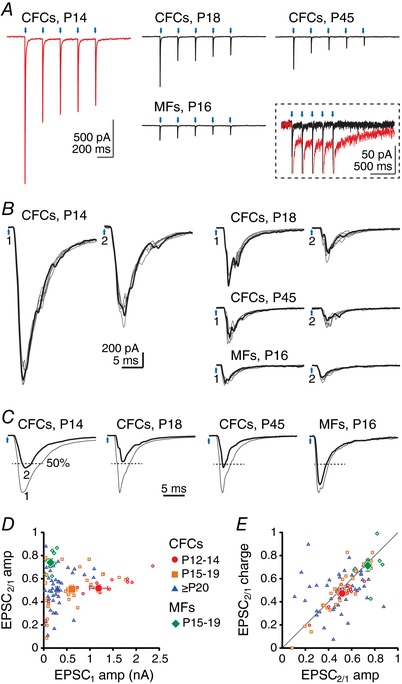
Figure 2. cfcEPSCs depress strongly in CbN neurons.

A, averaged EPSCs evoked by a 5 Hz train of light pulses at different ages with ChR2 expressed in climbing fibre collaterals (CFCs) or mossy fibres (MFs). Red, cfcEPSC at P14. Black, all other records. Blue arrows, stimulation times. Inset, all traces from A, magnified and superimposed to illustrate the small‐amplitude slow inward current (red, P14 trace). B, enlarged traces of responses to the first two stimuli of the 5 Hz train (200 ms interval) at different ages with ChR2 expressed in CFCs or in MFs. One example trace of six is highlighted. Blue arrows 1 and 2, stimulation times. C, superimposed normalized averages for EPSC1 and EPSC2. EPSC2 is highlighted. Dashed lines indicate 50% of EPSC1 amplitude. D, paired‐pulse ratio of EPSC amplitude (EPSC2/EPSC1 peak) vs. EPSC1 amplitude for CFC or MF stimulation following viral injection at P1. For cfcEPSCs: red circles, P12–14; orange squares, P15–19; blue triangles, P20–62. For mfEPSCs: green lozenges, P15–19. Filled symbols, mean data. E, paired‐pulse ratio of EPSC charge vs. paired‐pulse ratio of EPSC amplitude. Same symbols as in (C). Filled circle, square and triangle overlap and obscure one another.
