
Figure 3. Effect of extracellular Ca concentration on cfcEPSC depression.
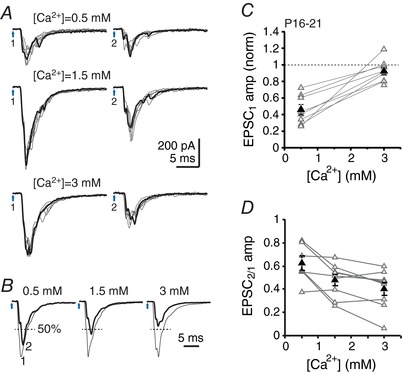
A, cfcEPSCs evoked by a pair of light pulses (200 ms interval) for different concentrations of Ca. One example trace of six is highlighted. Blue arrows 1 and 2, stimulation times. B, superimposed normalized averages for cfcEPSC1 and cfcEPSC2. cfcEPSC2 is highlighted. Dashed line indicates 50% of EPSC1 amplitude. C, cfcEPSC1 amplitude vs. Ca2+ concentration. Values are normalized to cfcEPSC1 amplitude in control extracellular calcium (1.5 mm). D, paired‐pulse amplitude ratio (cfcEPSC2/cfcEPSC1) vs. Ca concentration.