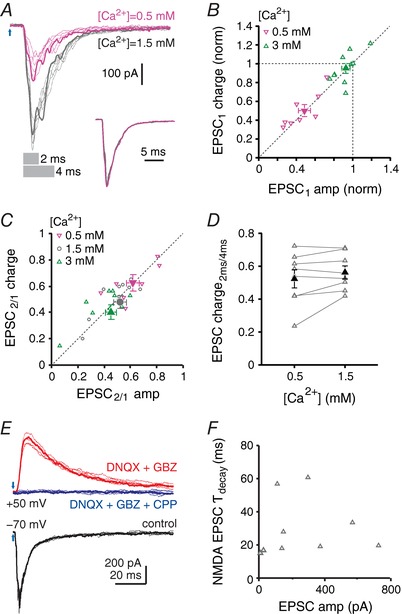
Figure 4. Composite cfcEPSCs are monosynaptic and independent of Ca concentration.

A, cfcEPSCs recorded in control (grey traces) and low Ca (pink traces). Grey bars indicate the duration of the trace (2 ms or 4 ms) over which charge was calculated in (D). For each condition, one example trace of six is highlighted. Inset, superimposed normalized averages. B, cfcEPSC1 charge vs. cfcEPSC1 amplitude. Values are normalized to cfcEPSC1 charge and amplitude in control Ca. Low Ca, 0.5 mm, downward pink triangles; high Ca, 3 mm, upward green triangles. Filled symbols are mean data. C, paired‐pulse charge ratio vs. paired‐pulse amplitude ratio. Low Ca, downward pink triangles; control Ca, grey circles; high Ca, upward green triangles. Filled symbols are mean data. D, relative charge transfer during the cfcEPSC, plotted as the ratio of charge transfer during the first 2 ms to the charge transfer during the first 4 ms vs. Ca2+ concentration (grey bars in A). E, example traces of control cfcEPSCs recorded at V hold = −70 mV (black), the NMDA component isolated at V hold = + 50 mV after addition of DNQX (10 μm) and gabazine (10 μm) (red), and blockade of synaptic responses by further addition of CPP (10 μm) (blue). For each condition, one example trace among of six is highlighted. F, NMDAR cfcEPSC decay time constant (τ) vs. cfcEPSC amplitude. V hold = + 50 mV.
