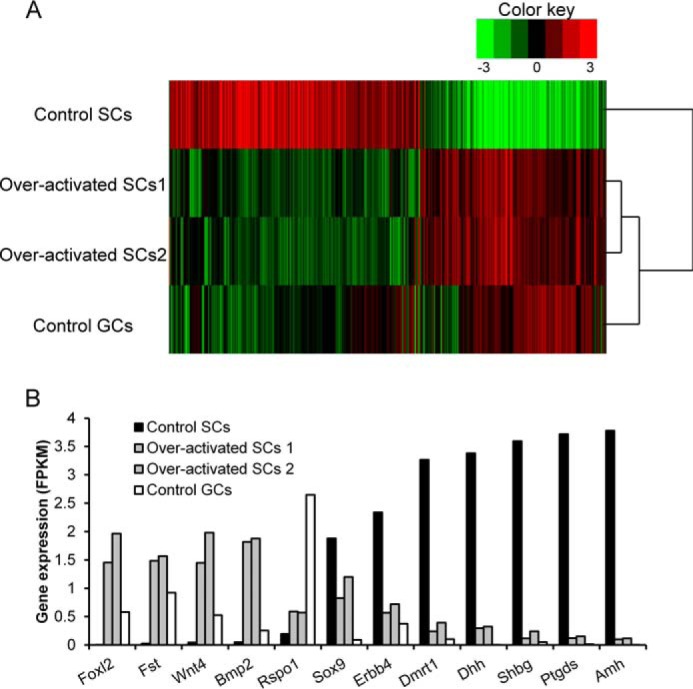
Figure 4.

Genome wide expression profiling of control granulosa cells at E14.5, control Sertoli cells, and Ctnnb1-overactivated Sertoli cells at E16.5 was analyzed by transcriptome sequencing analysis. A, heat map of the 1241 genes that were significantly altered (538 up-regulated and 703 down-regulated genes with at least 2-fold changes) from both control granulosa cells (Control GCs) and Ctnnb1-overactivated Sertoli cells (overactivated SCs) compared with control Sertoli cells (Control SCs). The red and green colors represent the relative expression level. B, a subset of granulosa cell-specific and Sertoli cell-specific genes selected from 1241 differentially expressed genes.
