Figure 4.
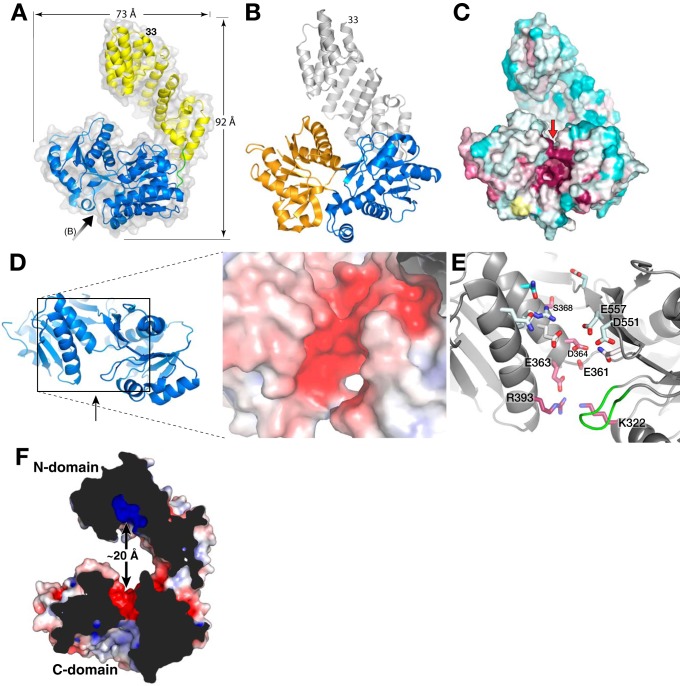
Full-length structure of LpoAOrt. A, schematic representation of LpoAOrt structure with the N domain colored yellow, C domain in blue, and linker (residues 251–256) in green. The black arrow indicates the view in B and C. B, schematic representation of LpoAOrt highlighting the C domain and its N lobe (blue) and C lobe (orange). The view is looking directly into the C-domain cleft (see arrow in A). C, solvent contact surface representation of LpoAOrt in the same view as B and colored according to sequence conservation (same color scheme as Fig. 1C). Highly conserved residues, suggesting a functional binding site, were observed in the cleft between the two lobes of the C domain. D, electronegative region on “top” of the C domain facing the N domain. The view is in the direction of the red arrow in C. E, residues forming the electronegative surface in D. Residues 345–350 are shown in green and are discussed under “Results.” F, cross-section of LpoA showing how the electronegative region at the top of the C domain is opposite the N-domain electropositive groove. The protein surface is colored by electrostatics.

