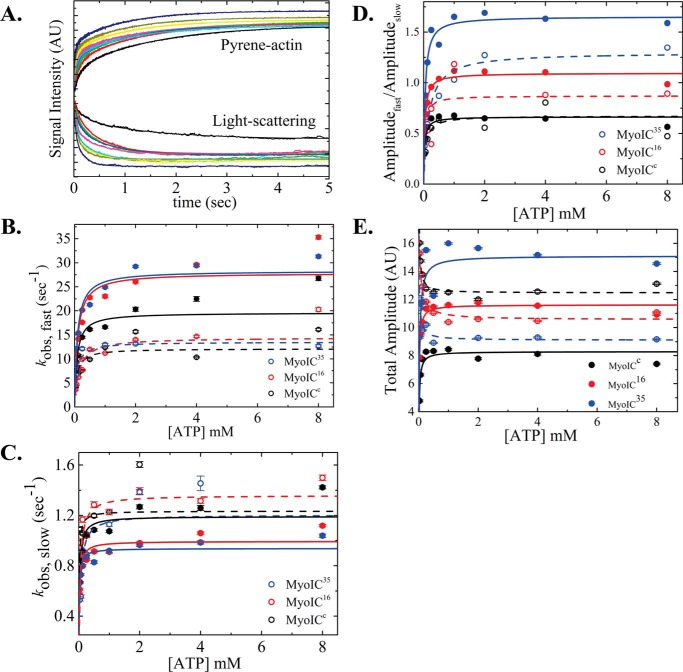
Figure 2.
ATP-induced population of weakly bound acto·MYO1C states. A, representative time courses of pyrene fluorescence enhancement and normalized light scattering reduction after rapid mixing of 25 nm acto·MYO1C16 isoform with 0, 0.03125, 0.0625, 0.125, 0.25, 0.5, 1, 2, 4, or 8 mm ATP. Data are averaged transients (n = 3). The data were best fitted to a double-exponential equation. MYO1CC (black), MYO1C16 (red), and MYO1C35 (blue) are shown as solid circles for pyrene fluorescence data and as open circles for light-scattering data. The solid lines for pyrene and dashed lines for light scattering represent the best fits to the data. B, the fast-phase kobs was best fitted to a rectangular hyperbola (Scheme 2 and Equation 1), giving the equilibrium constant for MgATP binding to actomyosin, K′1T, and the kinetic constant for isomerization after MgATP binding, k′+2T. C, slow-phase kobs,slow values plotted as a function of [MgATP]. The slow kobs was best fitted to a rectangular hyperbola (Scheme 2 and Equation 2), yielding the kinetic constant for the closed-to-open isomerization of the ATP-binding pocket, k′+α. D, a rectangular hyperbola was fitted to the data of the ratio between the fast (Afast) and slow (Aslow) time-course amplitudes, giving the closed-to-open nucleotide pocket equilibrium constant, K′α. E, amplitude of ATP-induced dissociation. The error bars of the fitting are within data points.

