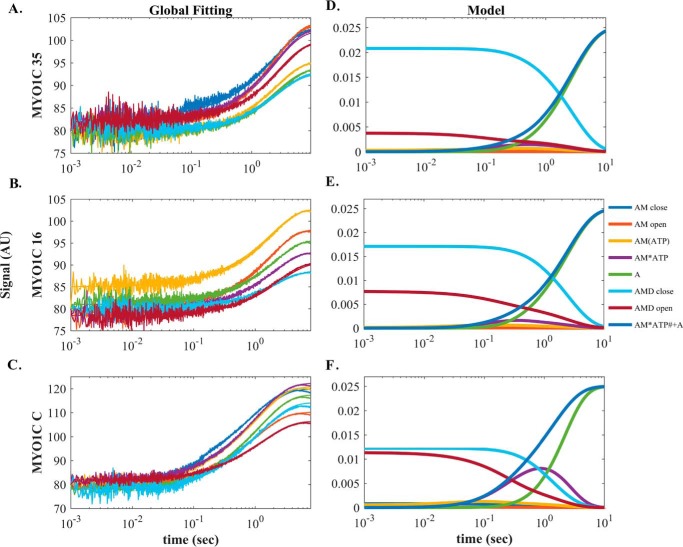
Figure 5.
Global numerical simulation of time-dependent distribution of reaction intermediates of Scheme 3. A–C, simulated data sets of the ATP-induced population of weakly bound acto·MYO1C·ADP states fitted to raw data from MYO1C35, MYO1C16, and MYO1CC. Each graph shows the time course of data collected after preincubation with 1.25 (blue), 2.5 (brown), 5 (yellow), 7.5 (purple), 10 (green), 20 (light blue), or 30 (dark red) μm prebound ADP mixed rapidly with 1 mm ATP, as presented in A for pyrene-labeled acto·MYO1C35·ADP ATP-induced dissociation. The solid lines through the data sets are fitted curves resulting from performing global numerical analysis on the entire set of data for each isoform. D–F, time-dependent distribution of biochemical intermediates according to the simulation mechanism shown in Scheme 3 for MYO1C35, MYO1C16, and MYO1CC. Blue, AMC; red, AMO; yellow, AM(ATP); purple, AM·ATP; green, A; light blue, AMDC; dark red, AMDO. The light blue line represents the sum of the AM·ATP and A states, which represent the pyrene signal of weakly bound or dissociation states. AMDC and AMDO traces were fitted to single and double-exponential equations, respectively. The fitting parameters, kobs,AMDC, AAMDC, kobs,fast,AMO, and Afast,AMDO, are shown in Table 4.

