Figure 7.

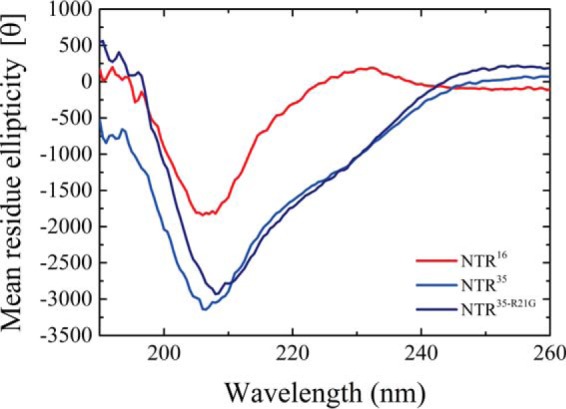
CD spectrum of the NTR peptides. Shown are the CD spectra of NTR16 peptide (red), NTR35 (blue), and NTR35-R21G (dark blue) at 20 °C. The data presented are an average of three measurements.

CD spectrum of the NTR peptides. Shown are the CD spectra of NTR16 peptide (red), NTR35 (blue), and NTR35-R21G (dark blue) at 20 °C. The data presented are an average of three measurements.