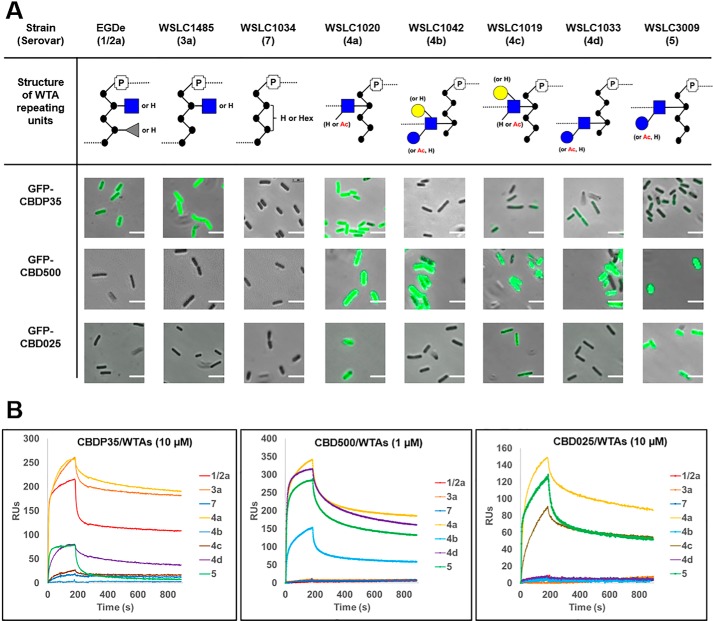
Figure 6.
WTA structure determines the binding specificity of bacteriophage endolysins. A, comparing the binding patterns of GFP-tagged CBDs to Listeria strains with diverse WTA structures. The images are made by merging both phase-contrast and fluorescence channel in the same field. Scale bar is 2 μm. CFG representation of monosaccharides: blue ●, Glc; blue ■, GlcNAc; grey ▴, Rha; yellow ●, Gal. B, binding specificity of immobilized CBDP35 (left), CBD500 (middle) and CBD025 (right) to respective Listeria WTAs by BIAcore analysis. The serovars used are shown in the legend. RU, relative units.

