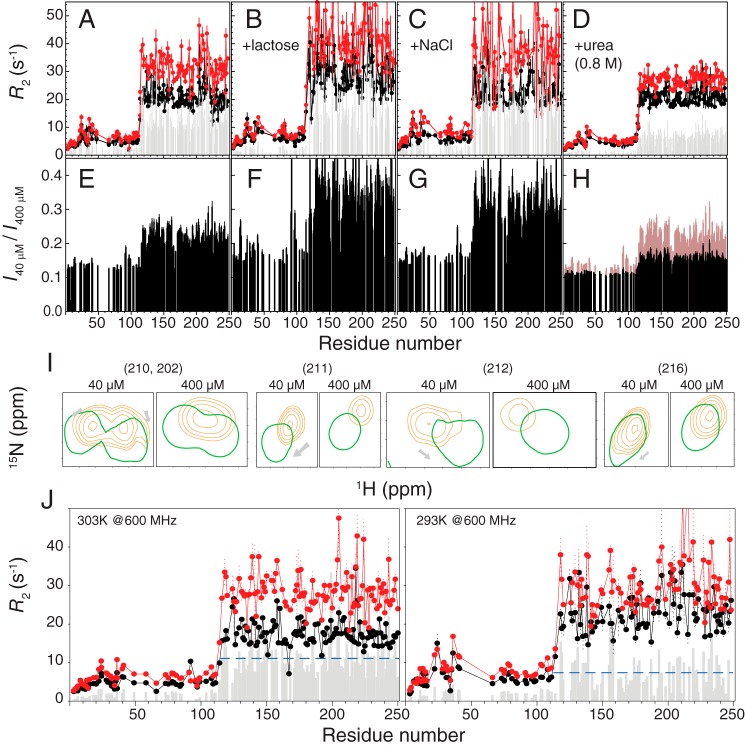
Figure 6.
Hydrophobicity drives the self-association of galectin-3. Shown are transverse relaxation rates (R2) for 40 (black) or 400 μm (red) samples of galectin-3 in buffer (A), with 250 mm lactose (B), with 100 mm NaCl (C), or with 0.8 m urea (D). Shown are ratios of HSQC peak intensities between 40 and 400 μm samples in buffer (E), with 250 mm lactose (F), with 100 mm NaCl (G), or with 0.8 m urea (H). E is overlaid in H for ease of comparison. I, representative HSQC peaks (residues 202, 210, 211, 212, and 216) from 40 and 400 μm samples in the absence (orange) or presence (green) of 0.8 m urea. J, R2 measured in a 14.1-tesla magnet at 303 K (left) or 293 K (right). The averaged ΔR2 values for both cases are indicated as blue dashed lines. A comparison between samples with and without 250 mm lactose at different protein concentration is shown in supplemental Fig. S5.

