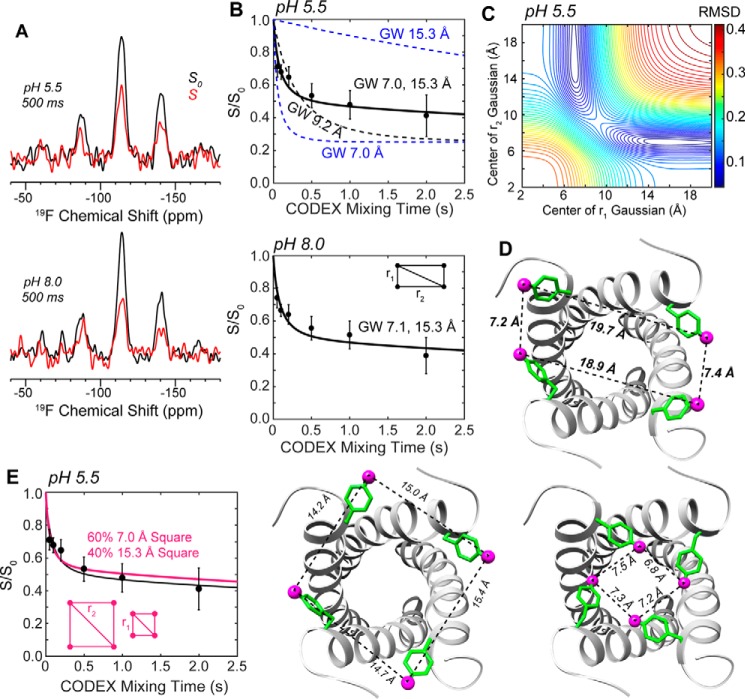
Figure 6.
19F CODEX data of 4-19F-Phe-5 labeled BM2(1–33) for determining interhelical distances at the N-terminal opening of the tetramer. A, representative CODEX spectra measured at 235 K under 10 kHz MAS. The control (S0, black) and dephased (S, red) spectra at pH 5.5 and pH 8.0 were measured at a mixing time of 500 ms. B, normalized CODEX intensities (S/S0) as a function of mixing time. The high and low pH samples show similar dephasing, indicating similar interhelical separations. The black dashed curve is the best-fit assuming a square geometry, whereas blue curves show the two distances that provide the best-fit assuming a rectangular geometry. All distance components are Gaussian-weighted (GW). C, r.m.s.d. between simulated rectangular-geometry CODEX curves as a function of distances (r1, r2) and the measured pH 5.5 data. D, structural model using the PDB 2KIX backbone showing Phe-5 with χ1 angles of +65°, −65°, +60°, −60°, which forms a rectangle geometry that satisfies the measured distances. E, simulated CODEX curve (magenta) for a weighted average of two square geometries, overlaid with the best-fit rectangular-geometry dephasing curve. The long-distance component is satisfied by a Phe-5 χ1 angle of −45°, whereas the short-distance component is satisfied using a χ1 angle of −135° to −145.

