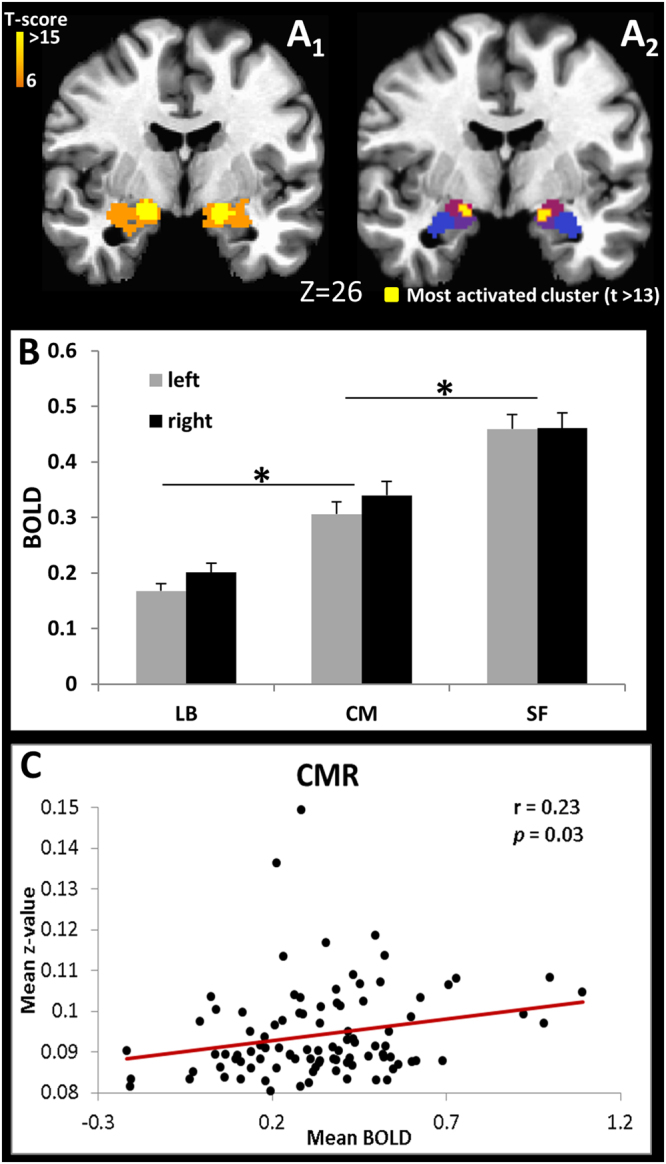
Figure 4.

(A) Amygdala activation for the threshold of T ≥ 6 (A 1), location of the most significant activated voxels (T > 13, peak value T = 17) (A 2) overlaid over the amygdala subdivisions, CM, LB and SF (color pattern from Fig. 1), radiological convention; (B) Average BOLD signal for each amygdala subdivision (*p < 0.0001); (C) ROI analysis correlating the mean BOLD signal at the CMR with the mean positive and significant (p < 0.05) Fisher transformed correlation values of the CMR connectivity pathway.
