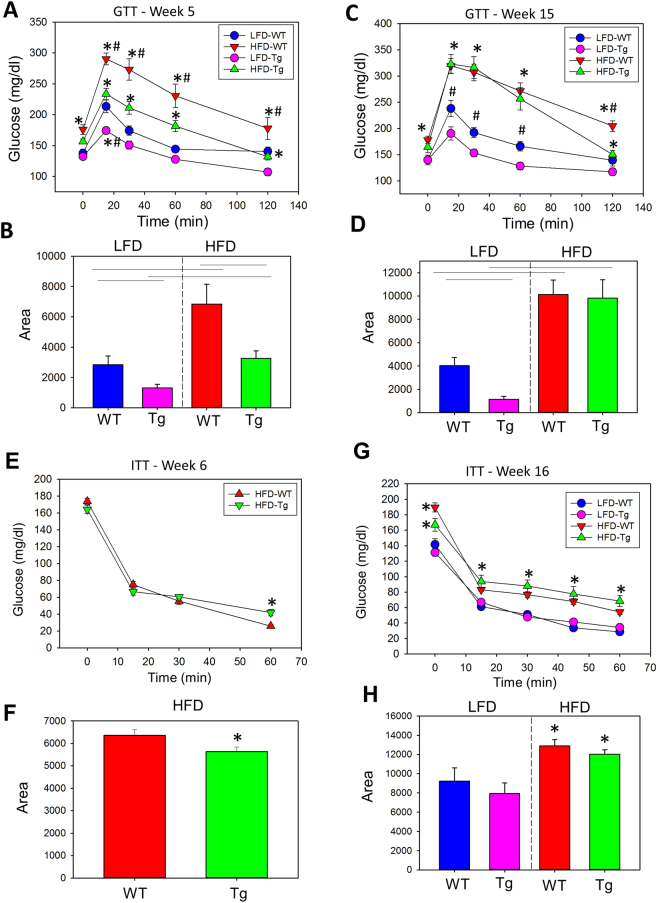
Figure 2.
CAST overexpression improved glucose tolerance in the early stage of obesity. Glucose tolerance test (GTT) and the area under curve (AUC) of GTT at week 5 (A,B) and week 15 (C,D) post LFD and HFD in CAST WT and Tg mice. Insulin tolerance test (ITT) and the AUC of ITT at week 6 (E,F) and week 16 (G,H) post LFD and HFD in CAST WT and Tg mice (n = 12–14). *Denotes P < 0.05 HFD vs LFD; #P < 0.05 CAST WT vs CAST Tg (Two-way ANOVA with Holm-Sidak post hoc analysis).

