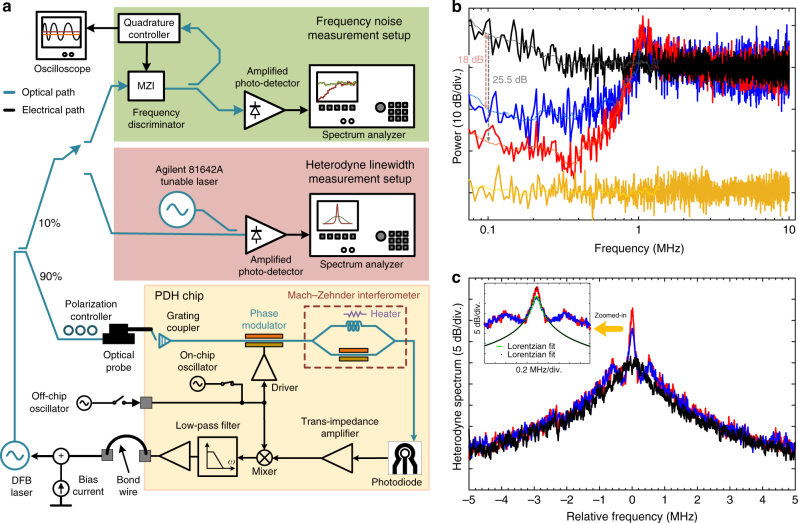
Fig. 6.
Frequency noise spectra and beat note spectral measurement. a The frequency noise and heterodyne linewidth measurement setups. For the frequency noise measurements, an optical fiber based Mach−Zehnder interferometer (MZI) is utilized as a frequency discriminator (Supplementary Note 4). The phase difference between the two arms of the MZI is set to 90o using the quadrature controller. To measure the heterodyne linewidth of the distributed feedback (DFB) laser before and after Pound−Drever−Hall (PDH) stabilization, the beat note between the DFB laser and an Agilent 81642A tunable laser is monitored on an electrical spectrum analyzer. b Frequency noise measurement. The measured closed-loop response of the reported PDH system is shown where the original frequency noise of the laser (black) is reduced by more than 25 dB (for A i = 112 dB) when an off-chip 150 MHz oscillator is used (red) and by more than 18 dB when the on-chip 280 MHz oscillator is used (blue). The noise floor of the measurement setup is shown in yellow. c The full-width at half-maximum (FWHM) linewidth measurement. The beat note between the DFB laser and an Agilent 81642A tunable laser is monitored on an Agilent 8563E electrical spectrum analyzer. Under the closed-loop condition, the linewidth of the free-running laser (black) is reduced using on-chip oscillator (blue) and off-chip oscillator (red). The inset shows the zoomed-in heterodyne spectra with Lorentzian fits

