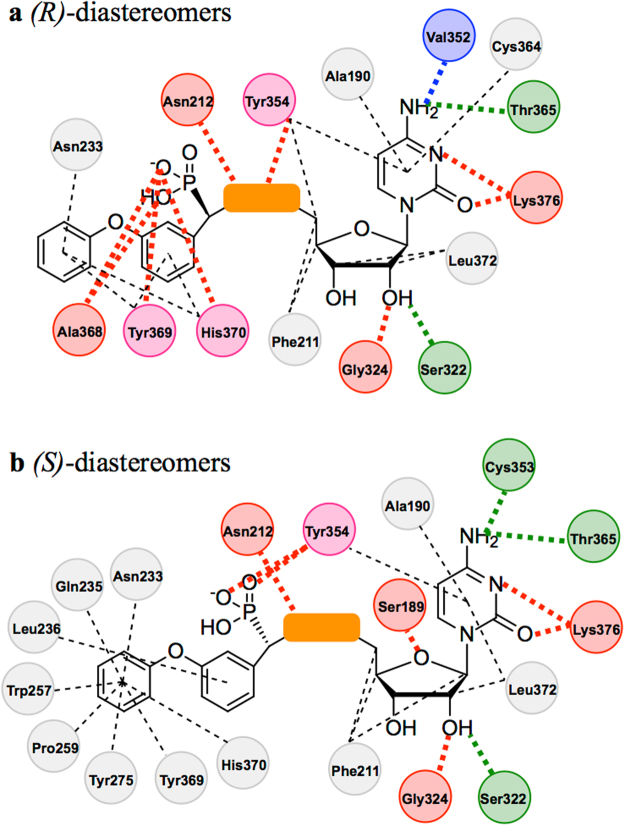
Figure 4.
Schematic representation of conserved hydrogen bonds and hydrophobic contacts observed in the (R)-diastereomer- (a) and (S)-diastereomer-ST6Gal I complex (b) simulations. The consistent components of each inhibitor are shown as chemical structures. The orange box represents the different linkers. Interacting human ST6Gal I residues are represented as circles which are colour coded based on interaction type as follows: Red = hydrogen bond donor; Green = hydrogen bond acceptor; Blue = water bridged hydrogen bond; Grey = hydrophobic contact; Pink = hydrogen bond and hydrophobic contact. Dashed lines indicate hydrophobic contacts and dotted lines represent the hydrogen bonds shown in Supplementary Tables S4–S15.

