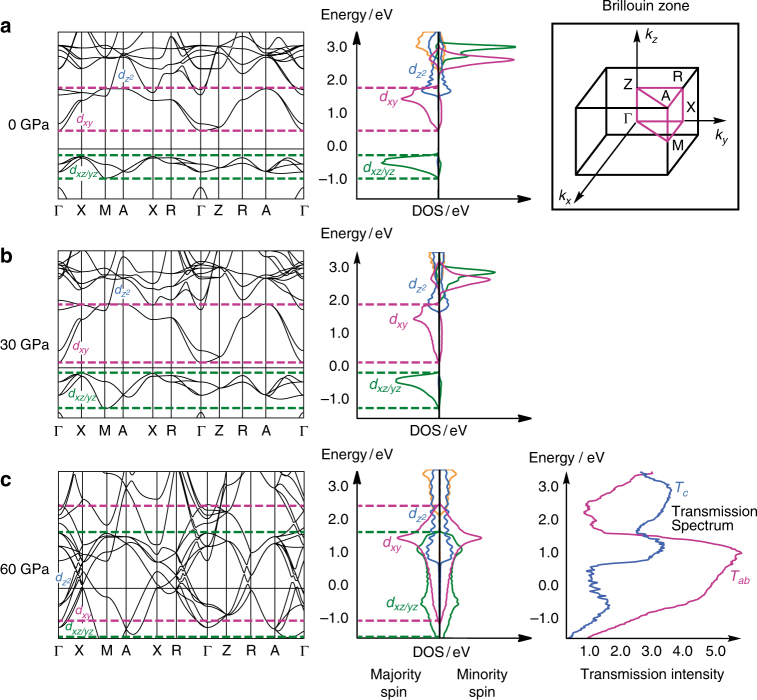
Fig. 4.
Density functional theory for SrVO2H. DOS and band structure, a at ambient pressure, b at 30 GPa, and c at 60 GPa. The transmission spectrum along the c-axis (T c, blue line) and along the V–O–V bisector (T ab, purple) is also shown in plot c for the high-pressure state. Majority- and minority-spin states in the DOS are shown to the left and right of the axis, respectively. The first Brillouin zone for the tetragonal lattice is shown in the inset

