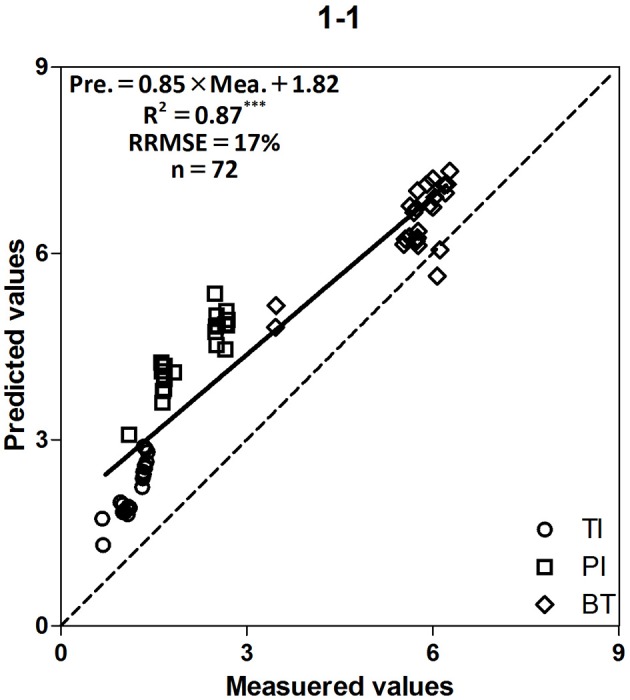
Figure 4.

Relationship between measured and predicted LAI values of two Japonica cultivars at the tillering, panicle initiation and booting stages. The solid line denotes the linear regression and the dotted line is a line inclined at 45° to the axes. ***F-test statistical significance at 0.001 probability level.
