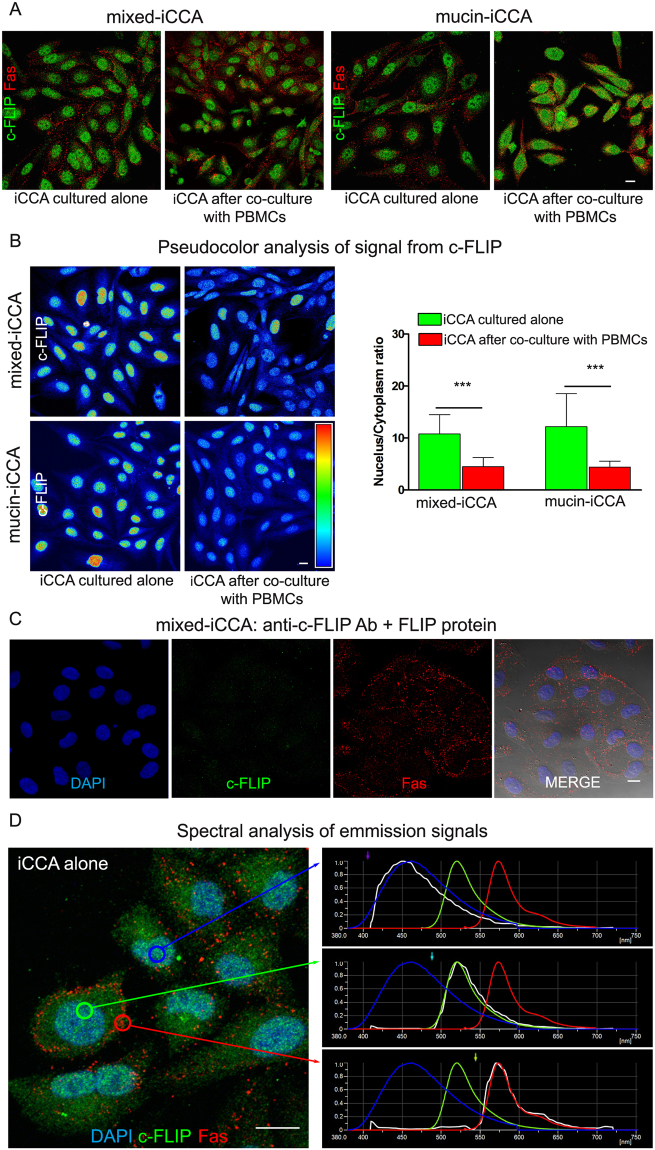
Figure 4.
Confocal immunofluorescence analysis of iCCA cells. (A) c-FLIP and Fas double labeling of iCCA cells cultured alone and after 24 h of co-culture with PBMCs. Scale bar = 10 µm. (B) Pseudocolor analysis of c-FLIP immunolabeling in both iCCA cells. Histograms reported on the right side of pseudocolor images represent the mean ± SD of the ratio of nucleus/cytoplasm expression of c-FLIP in both cancer cell types cultured alone, in comparison with cancer cells co-cultured with PBMCs (***P < 0.001). (C) Specificity control of c-FLIP antibody. Sample was counterstained with DAPI and anti-Fas Ab. Fluorescence images were superimposed to DIC image. (D) Triple immunofluorescence of mixed-iCCA cells by: DAPI; anti-c-FLIP Ab detected by Alexa488 conjugated secondary Ab; anti-Fas Ab detected by alexa546 conjugated secondary Ab. Spectral confocal analysis of signals from DAPI, alexa488 and alexa546 fluorochromes was shown in the graphs on the right side. Theoretical emission spectra of fluorochromes was represented in the respective color (DAPI in blue; alexa488 in green; alexa546 in red) whereas real emission spectrum was represented in white. Circles in the image indicate areas of analysis.

