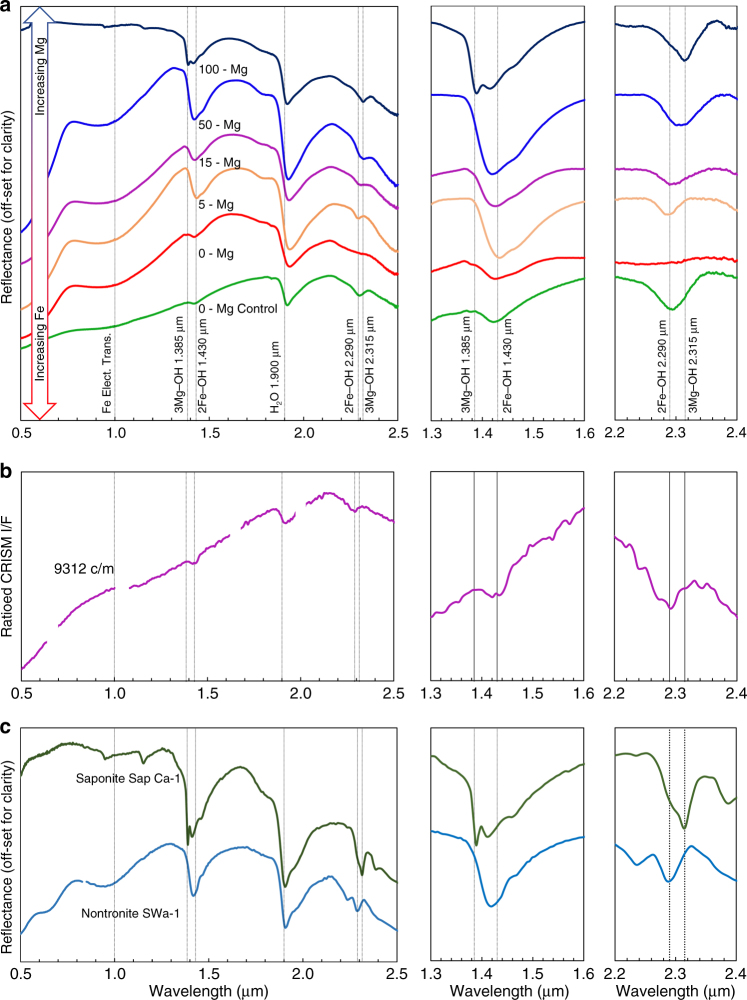
Fig. 2.
VNIR reflectance spectra of the synthetic clay minerals. a VNIR spectra of Fe/Mg-rich clay minerals produced in this study, with Mg concentrations indicated on the figure in percent cation. The 0-Mg control (green) indicates the synthetic nontronite control formed from aqueous ferrous solutions using previously published methods from Mizutani et al.9 and Decarreau et al.8, and 0-Mg (red) indicates the 100% Fe3+ product formed under oxidized conditions. The absorption band for each synthesized material between 1.3–1.6 μm and 2.2–2.4 μm is enlarged for clarity, and has had the continuum removed. Samples with increasing concentrations of Mg (from 0 to 100%) show shifts in the position of hydroxyl-related absorptions as octahedral Fe (2Fe–OH bands at 1.43 μm and 2.285 μm) is replaced by Mg (3Mg–OH bands at 1.385 μm and 2.315 μm)14,23,24. b VNIR CRISM spectra of Fe-rich smectite from the Nili Fossae region, Mars from Ehlmann et al.23 and c VNIR spectra of saponite (Mg-rich smectite) and nontronite (Fe3+-rich smectite) from the United States Geological Survey spectral library22 have similar absorption positions and shapes as the clay minerals precipitated in this study

