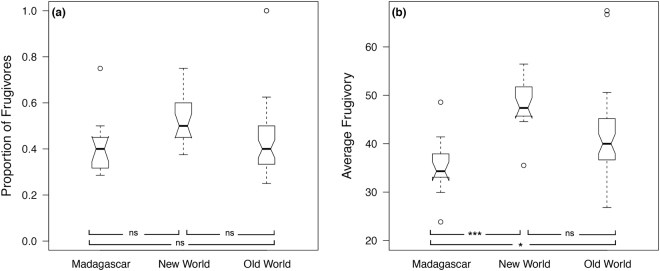
Figure 1.
Notched boxplot representing the comparison in the proportion of frugivorous primates (a) and the average frugivory in primate diets (b) at 62 sites in Madagascar, New World, and Old World (raw data; without correction for autocorrelations). While the boxes encompass the interquartile range, the notches represent the 95% confidence interval of the median (central line). Proportion of frugivorous primates is represented as proportion of primate species with more than 50% fruits in their diet. *p < 0.05; ***p < 0.001; ns = non significant.

