
FIGURE 2.
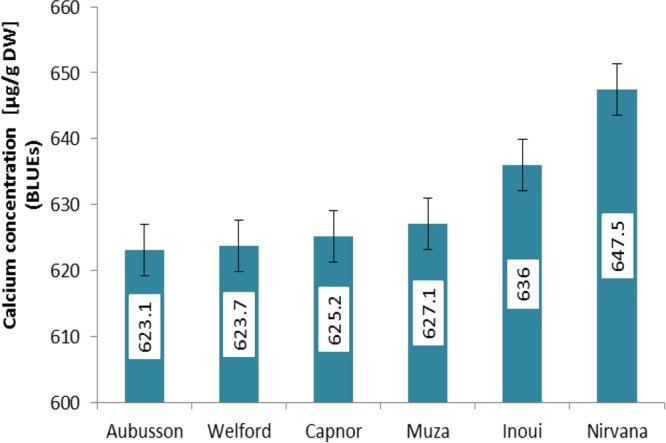
Calcium concentrations of the top 6 accessions [Ca > 600 (μg g-1 DW)] based on BLUE values ± SE. Numbers on the y-axis represent the calcium concentration.
Official websites use .gov
A
.gov website belongs to an official
government organization in the United States.
Secure .gov websites use HTTPS
A lock (
) or https:// means you've safely
connected to the .gov website. Share sensitive
information only on official, secure websites.
Calcium concentrations of the top 6 accessions [Ca > 600 (μg g-1 DW)] based on BLUE values ± SE. Numbers on the y-axis represent the calcium concentration.