
FIGURE 3.
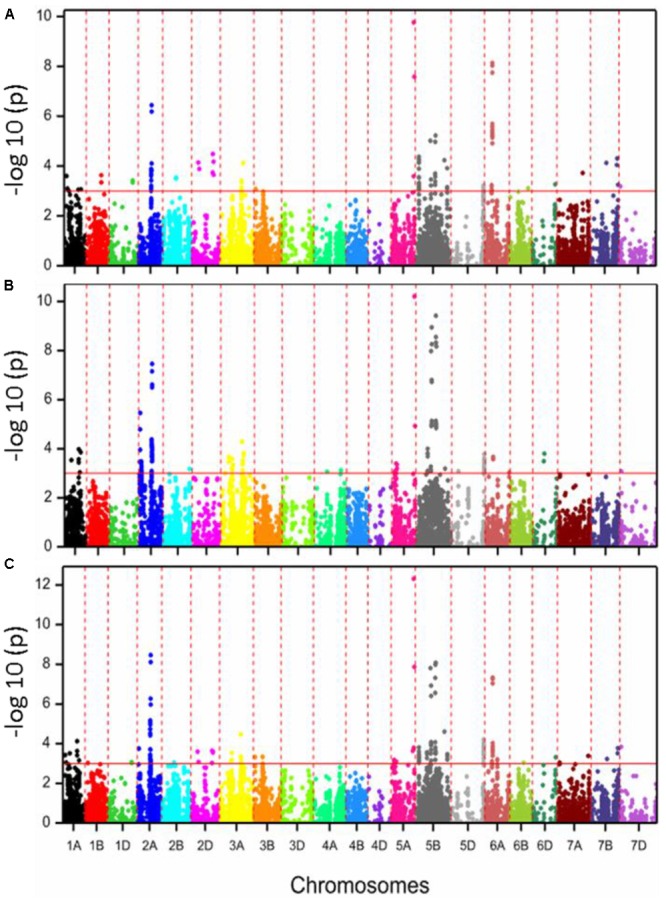
Manhattan plots with –log P-values of SNPs associated with calcium concentration values for 353 European wheat varieties based on 2015 (A), 2016 (B), and BLUE values (C). (A–C) The red line color in the figure shows the threshold of –log10 (P-value) of three and all the significantly associated SNP markers are above the red line.