
FIGURE 4.
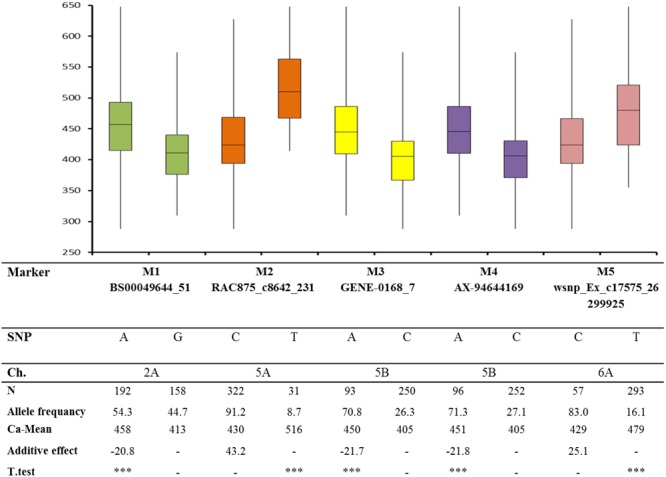
Box plot analysis for five significant markers based on BLUEs for calcium trait (MAF = AF). ∗∗∗denotes 0.001.
Official websites use .gov
A
.gov website belongs to an official
government organization in the United States.
Secure .gov websites use HTTPS
A lock (
) or https:// means you've safely
connected to the .gov website. Share sensitive
information only on official, secure websites.
Box plot analysis for five significant markers based on BLUEs for calcium trait (MAF = AF). ∗∗∗denotes 0.001.