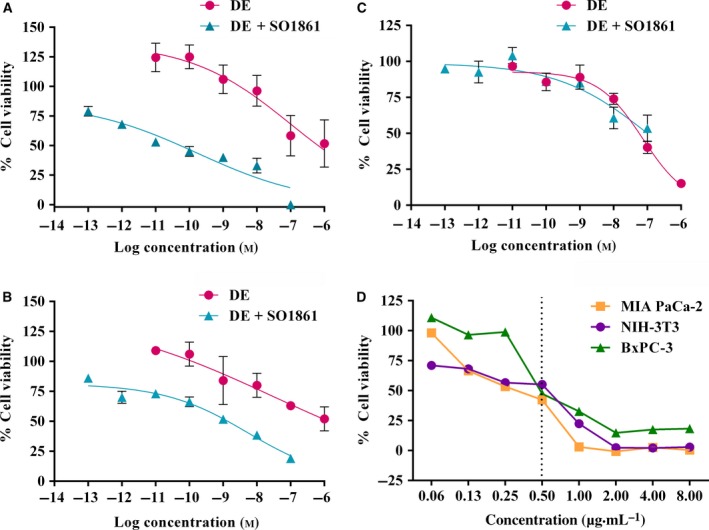
Figure 2.

SO1861‐mediated augmentation of HisDianthin‐EGF (DE). (A, D) BxPC‐3, (B, D) MIA PaCa‐2, and (C, D) NIH‐3T3 cells were seeded in 96‐well plates and grown for 24 h. Cells were then treated with (A–C) varying concentrations of HisDianthin‐EGF in DMEM (MIA PaCa‐2, NIH‐3T3) or RPMI 1640 (BxPC‐3) in the presence and absence of SO1861 (0.5 μg·mL−1), or (D) at a fixed concentration of HisDianthin‐EGF corresponding to the IC 50 shown in Table 1 and varying concentrations of SO1861. Cells were further incubated for 48 h. Viability was determined by an MTT assay. Each value represents the mean of three (two for panel (D)) independent experiments performed in quadruplicate. Single outliers defined as outside ± 3‐fold standard deviation were omitted in (D). A statistical significant effect between single and combination treatments was observed in MIA PaCa‐2 (Student's t‐test; P < 0.05) and BxPC‐3 (Student's t‐test; P < 0.01) cell lines. The vertical line in (D) indicates the SO1861 concentration used in (A–C) to determine the IC 50 of HisDianthin‐EGF and is thus the expected IC 50 for the variation in SO1861.
