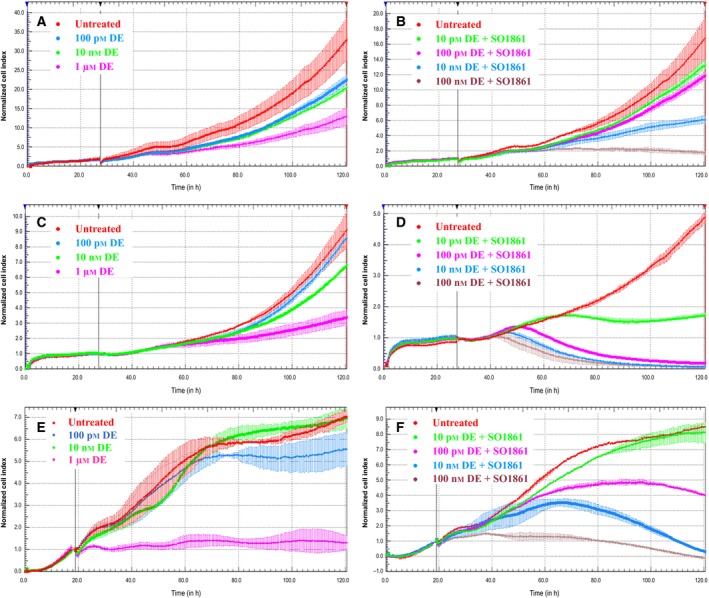
Figure 3.

Real‐time cell analysis showing the dose‐dependent increase in cytotoxicity in monotherapy with HisDianthin‐EGF (DE) (A, C, E) and in combination therapy together with SO1861 (B, D, F) in EGFR‐overexpressing MIA PaCa‐2 cells (C, D) and BxPC‐3 cells (E, F) as compared to NIH‐3T3 cells (A, B), which is an off‐target cell line. The y‐axis shows the impedance‐based cell index that was normalized to 1.0 after 28 h in case of NIH‐3T3 and MIA PaCa‐2 cells and, due to faster cell proliferation, after 19 h in case of BxPC‐3 cells just before treatment started. The cell index can be assumed to be proportional to the number of living cells.
