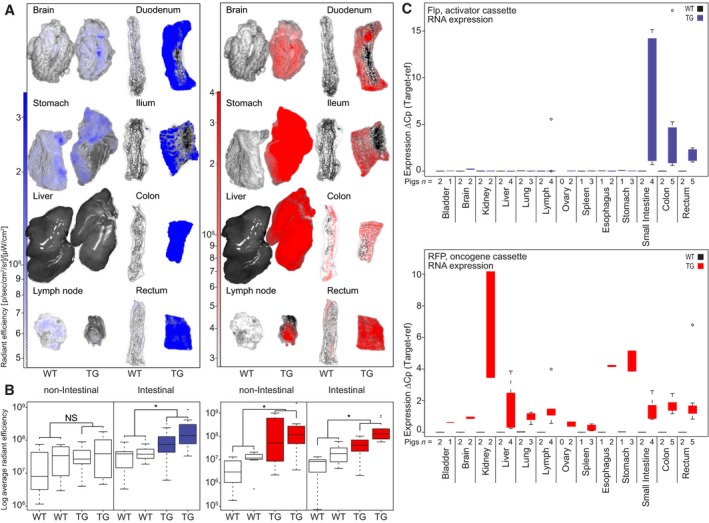
Figure 2.

Fluorescence reporters and RT‐qPCR show intestinal‐specific expression of villin‐BFP and universal expression of CAG‐RFP. (A) IVIS analysis of isolated organs from TG minipigs (n = 2) and landrace WT pigs (n = 2) depicted are image overlays of bright field and fluorescence; (B) quantification of the IVIS‐collected data on nonintestinal and intestinal organs from two TG pigs and two WT landrace pigs (for images and raw values, Fig. S4). N.S. = not significant, *P < 0.05. Boxplots indicate the interquartile range and median. Minimum/maximum values are represented by whiskers and outliers by dots; (C) RT‐qPCR‐based assessment of RFP and Flp expression in organs from TG pigs (n = 5). The expression was normalized to the geometric mean of the reference genes RPL4, HPRT, and TBP.
