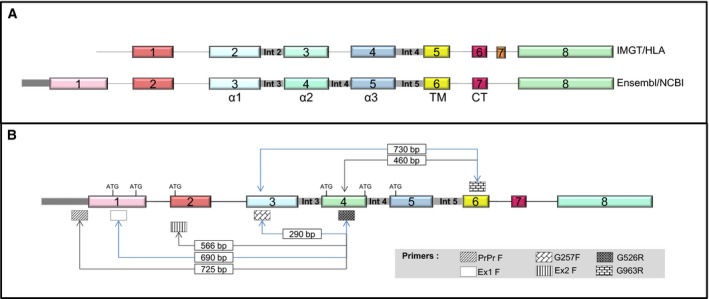
Figure 1.

Schematic representation of the structure of the HLA‐G gene. (A) IMGT/HLA nomenclature (top) and Ensembl database (bottom). Numbers represent exons and the domains of the HLA‐G protein are shown underneath. TM, transmembrane; CT, cytoplasmic tail. (B) Localization of primers used for the different RT‐PCR strategies. Sizes, in bp, for specific amplicons and the translation initiation codons are indicated.
