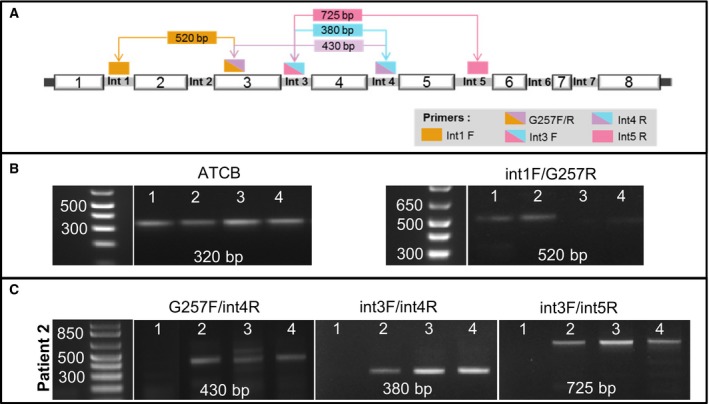
Figure 5.

Molecular validation of main intron retention events. (A) Diagrammatic representation of the RT‐PCR strategy developed to amplify retained introns. (B) Results of the RT‐PCR analysis using actin primers as control for the absence of genomic DNA (left) and Int1 and G257R primers to detect the presence of intron 1 (right). The band of 523 bp reveals the absence of intron 2, which would produce a band of 649 bp (C) HLA‐G transcripts that retain only intron 4 (left panel) or HLA‐G transcripts that retain several introns simultaneously (middle and right panels).
