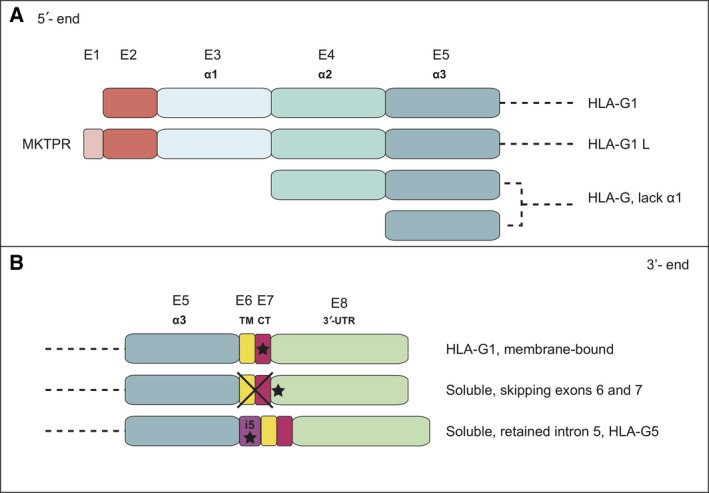
Figure 9.

Diagrammatic representation of potentially expressed HLA‐G isoforms generated by alternative spliced transcripts. (A) N‐terminal ends including the additional five‐amino acid region of HLA‐G1L and the absence of the α1 domain that might yield isoforms containing the α2α3 domains or only the α3 domain. (B) Diagrammatic representation of isoforms with potentially different C‐terminal ends.
