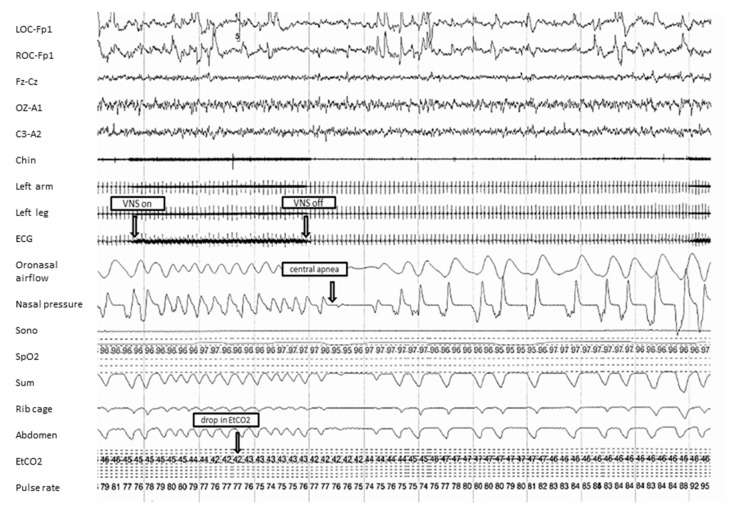
Figure 1.
A representative 120-s fragment from the first overnight diagnostic polysomnogram. The figure shows tachypnea at the time of vagus nerve stimulator (VNS) activation, followed by central apnea. VNS-on and VNS-off were identified based on artifact observed in the electrocardiogram (ECG) lead. Mean end-tidal carbon dioxide ranged between 20–52 mm Hg, with 0.2% of the total time spent with an end-tidal carbon dioxide level greater than 50 mm Hg. Sono: sonogram; SpO2: oxyhemoglobin saturation (in %); Sum: summation channel of thoracic and abdomen inductance plethysmography; EtCO2: end-tidal carbon dioxide (in mm Hg).

