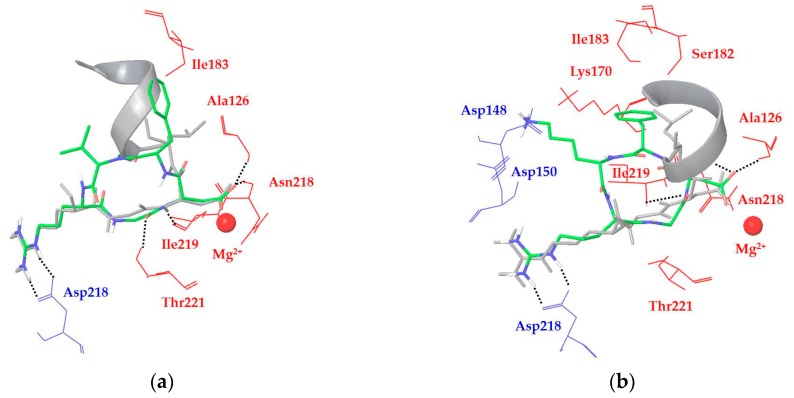
Figure 2.
Docking best poses of (a) ligand 1a (green) and (b) ligand 1c (green) overlaid to the X-ray structure of the TGF-β3 undecapeptide (grey, α-helix represented as a ribbon) into integrin αVβ6 (from 4UM9.pdb). Only selected integrin residues involved in interactions with the ligand are shown and labeled in blue for αV and red for β6. Non-polar hydrogens are hidden for clarity, while intermolecular hydrogen bonds are shown as black dashed lines.

