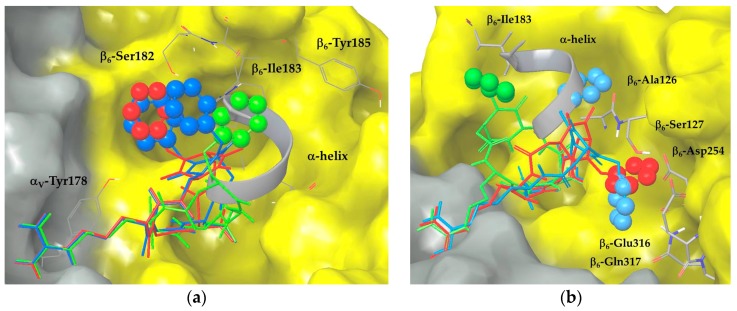
Figure 3.
Docking best poses of (a) ligands 2 (red), 4 (green) and 5 (blue) and (b) ligands 3 (red), 6 (green) and 7 (blue) into integrin αVβ6 (αV surface in grey, β6 surface in yellow). The X-ray structure of the TGF-β3 α-helix portion is shown as a grey ribbon. Ligand aromatic rings are represented as space-filling spheres.

