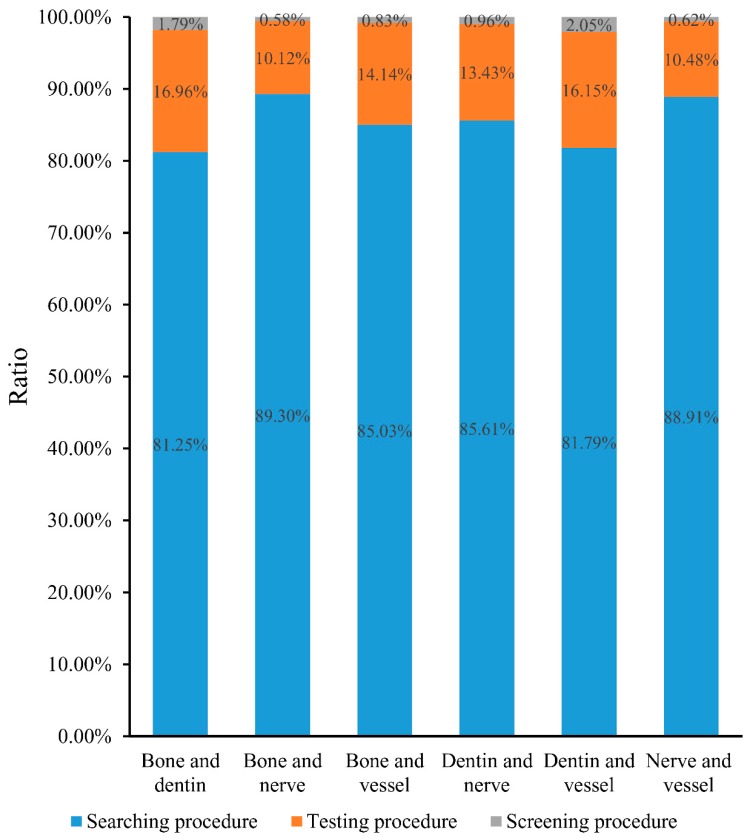
Figure 2.
A bar chart to illustrate the ratio of shortest path genes obtained in one procedure and screened out in the following procedure. In detail, blue represents the ratio of shortest path genes that were obtained in the searching procedure and screened out in testing procedure; orange represents the ratio of shortest path genes that were obtained in testing procedure and screened out in screening procedure; and gray represents the ratio of shortest path genes that were obtained in the screening procedure.

