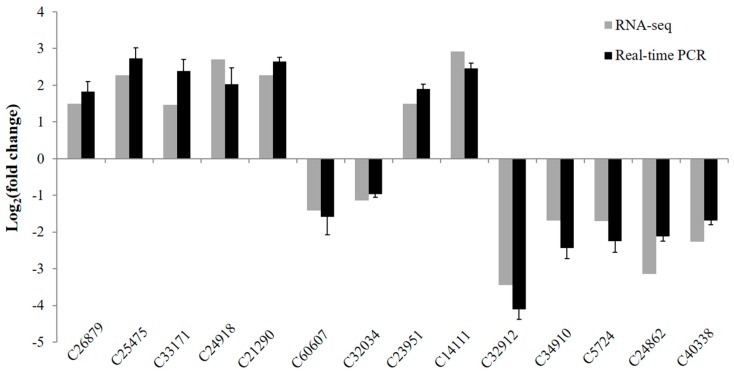
Figure 8.
Validation of RNA sequencing (RNA-seq) expression profiles by real-time PCR. The gray bars stand for fold changes based on read count number from normalized RNA-seq data. The black bars stand for fold changes of relative expression levels that were obtained by real-time PCR based on the 2−ΔΔCt algorithm. Values are mean ± SD (n = 3).

