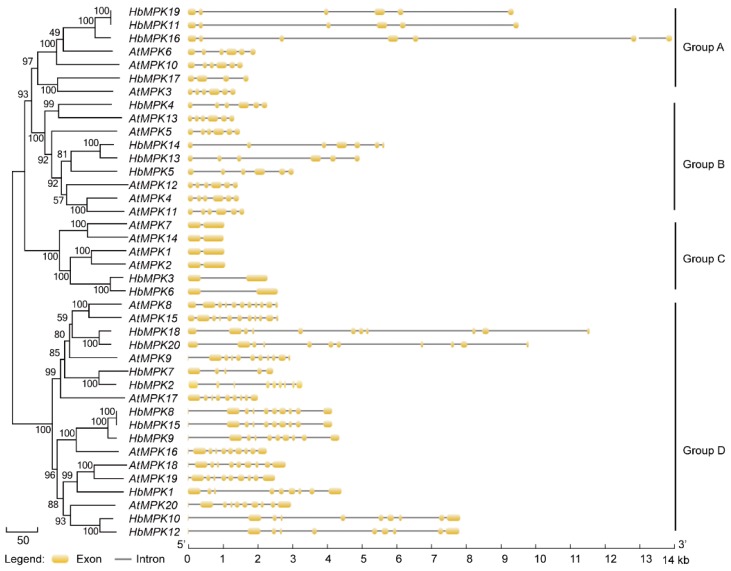
Figure 6.
Phylogenetic and exon-intron structure analyses of MPK genes in Arabidopsis (At) and Hevea (Hb). The cladogram (left) was constructed using MEGA5.0 as described above. The exon-intron distribution (right) was analysed using GSDS software. Introns and exons are represented by lines and yellow boxes. The scale bar for genomic length is indicated at the bottom.

