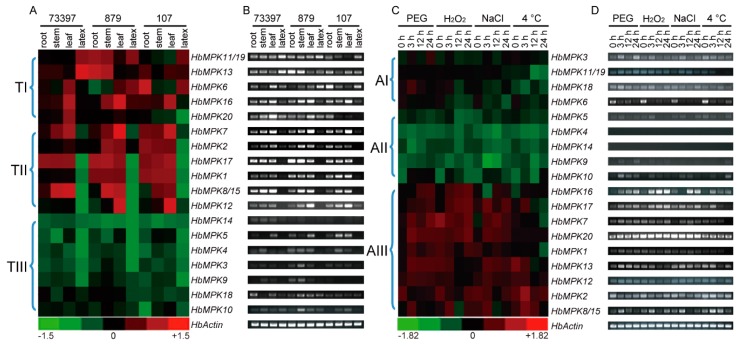
Figure 8.
Expression profiles of HbMPKs in different tissues and stresses obtained from three cultivated varieties of rubber tree. Expression patterns of HbMPKs in different tissues from different cultivated varieties were determined using quantitative real-time PCR (qRT-PCR) (A), and semi-quantitative PCR (B). Moreover, heat map of qRT-PCR (C) and electrophoretogram of semi-quantitative PCR results (D) for 20 HbMPKs at 0 h, 3 h, 12 h, and 24 h under osmotic (polyethylene glycol, PEG), oxidative (H2O2), salt (1 M NaCl), and cold (4 °C) stresses are shown. The colour bar at the bottom indicates the log2 value of the expression fold change compared with that of the HbActin reference gene. The genes were ordered by the cluster of their expression patterns.

