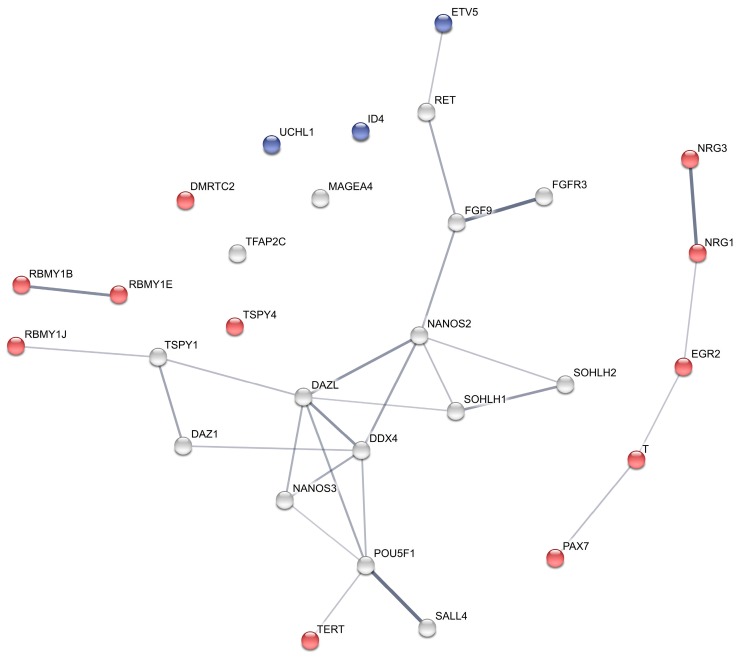
Figure 3.
Protein interaction network of differentially expressed gonocyte and spermatogonial marker genes in Ad−/Ad+ and after GnRHa treatment. Protein coding genes which up- or downregulated after GnRHa treatment are represented by red and blue nodes, respectively. STRING was used to predict the protein interaction network [25] with a confidence cut-off of 0.4. Line-weight represents the strength of data support between the predicted interactions.

