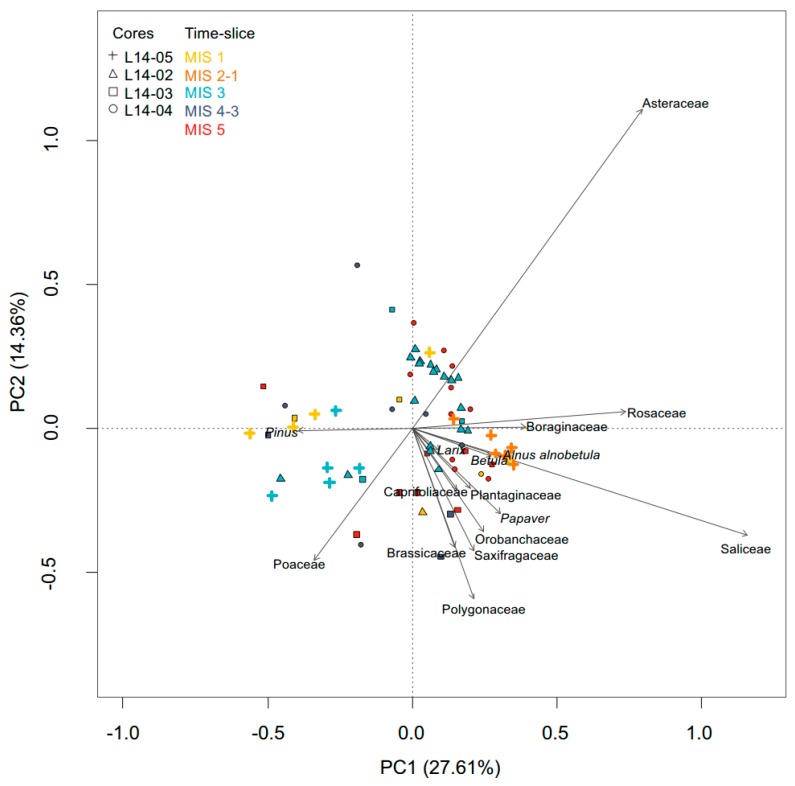
Figure 5.
Principal Components Analysis (PCA) biplot comprising the 15-principal terrestrial sedaDNA taxa (with herbs and non-erect dwarf-shrubs at family level) and Larix. Samples are coloured according to the corresponding marine isotope stage (MIS 1 in yellow, MIS 2 to MIS 1 transition in orange, MIS 3 in light blue, MIS 4 to MIS 3 in dark blue and MIS 5 in red) and the different symbols indicate the core from which the samples were taken (L14-05 with a cross, L14-02 a triangle, L14-03 a quadrate and L14-04 a circle).

