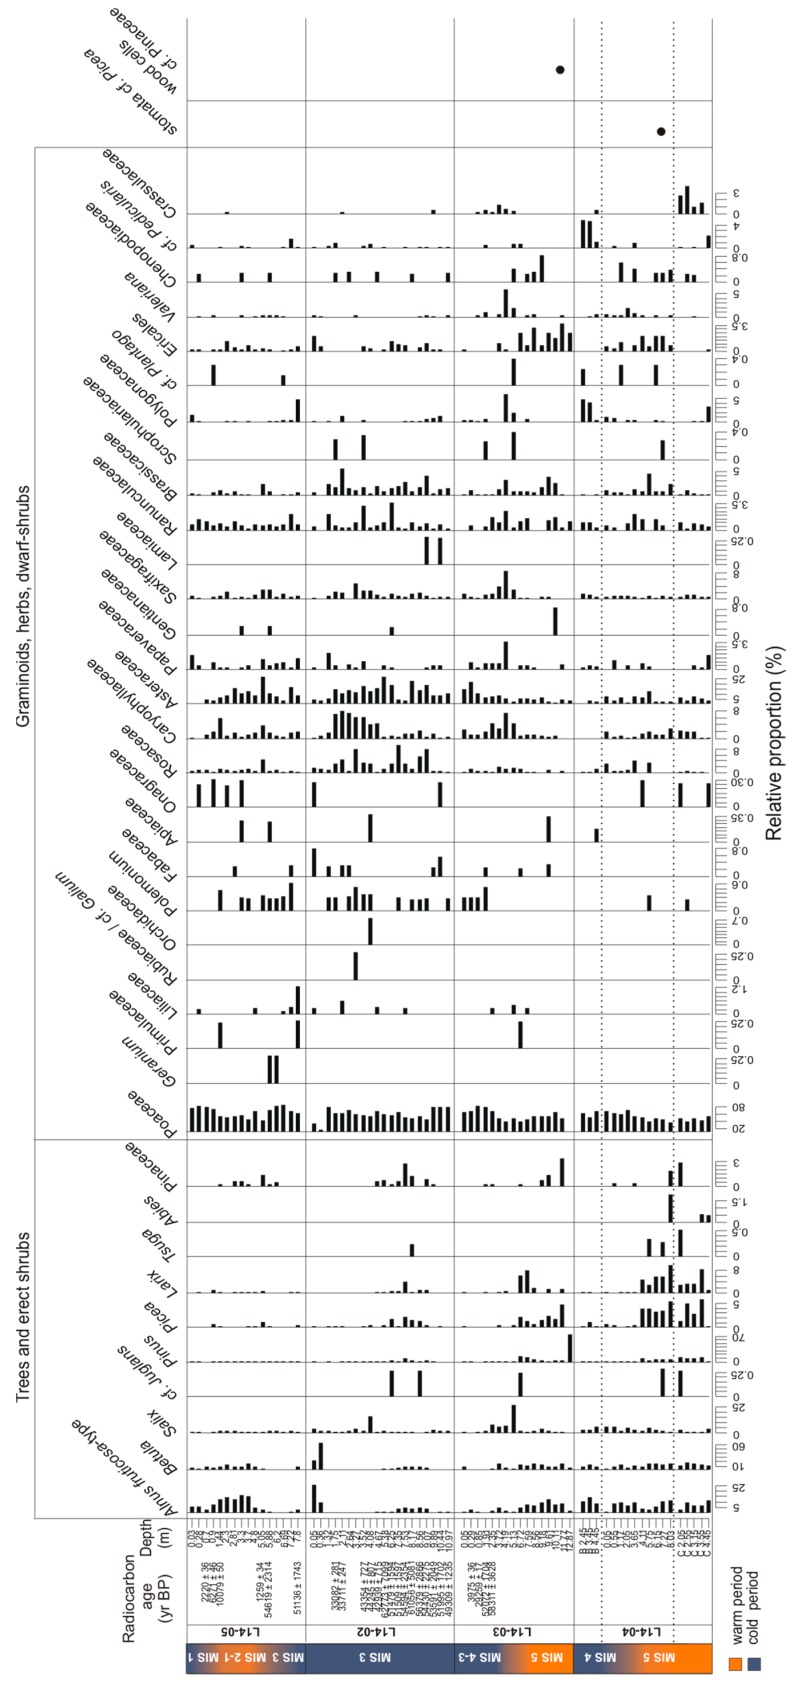
Figure 6.
Stratigraphic diagram of relative proportions of terrestrial pollen in each sample of the four permafrost cores (L14-05, L14-02, L14-03, L14-04) and the hand-pieces (collected soil nuggets from outcrops: L14-04B, L14-04C). The presence of coniferous stomata and wood cells is marked by a black dot. The radiocarbon ages (yr BP) and the corresponding MIS are displayed on the left side, with warmer periods in orange and colder periods in blue. The scales of the relative proportions are adjusted for each taxon.

