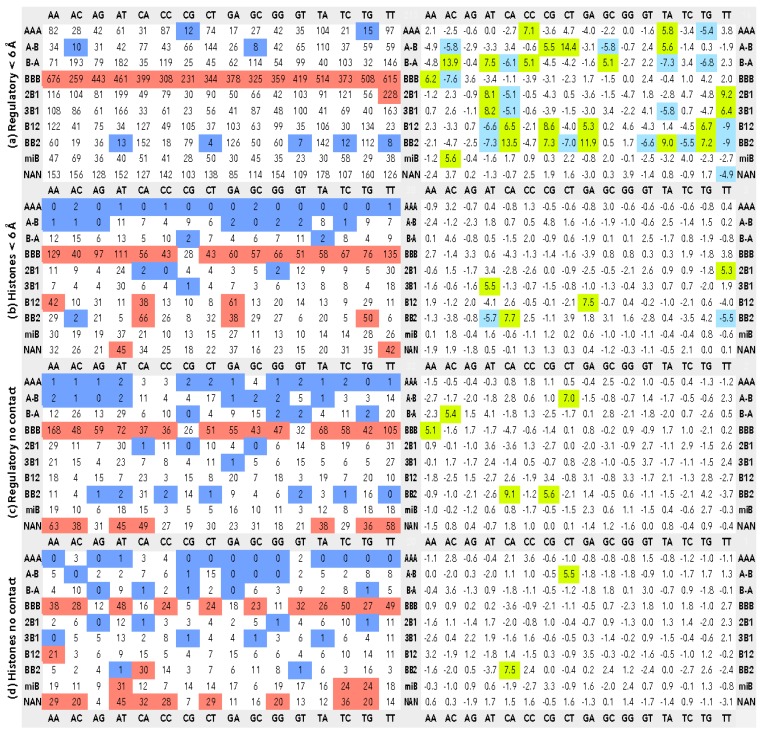
Figure 1.
The associations between dinucleotide sequences and structures classified as CANA letters. The matrices in the left column show the instances of the observed CANA/sequence associations, the right column the corresponding standardized Pearson residuals (SPR). Matrices (a) and (c) show statistics for DNA in complexes with regulatory proteins, (b) and (d) for DNA in the nucleosome core particles; (a) and (b) concerns dinucleotides in contact with proteins. Dinucleotides in contact with proteins are closer than 6.0 Å from an amino acid. Matrices (c) and (d) show data for dinucleotides not in contact with protein. The red highlight shows CANA/sequence associations with twice as many observations as the average for the dinucleotide group; the blue highlights associations smaller than 15% of the average. Green (blue) highlights show SPR with probability less than 1.0 × 10⁻⁶ for over- (under-) populated associations. Editable version of the figures is in Supplementary Table S3 in the XLSX format so that the color highlights can be modified.

