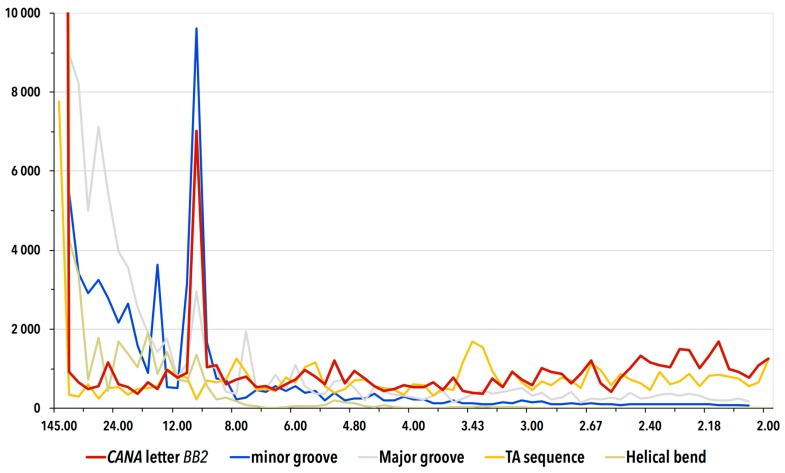
Figure 5.
Periodograms of the occurrence of the CANA letter BB2, the minor and major groove widths, TA sequence, and helical axis bend along the DNA in NCP calculated by discrete Fourier transform. The periodograms display the signal averaged from 32 chains in the fifteen analyzed histone structures. The vertical axis measures intensity of the FFT signal, the horizontal axis is labeled as 1/frequency and shows potential periodic behavior. The signal with periodicity of ~10 steps, i.e., 11 nucleotides for the BB2 CANA letter and the minor groove width is strong with intensities well above the values of their respective estimated standard deviations. The high intensity peaks near periodicity of 145 nucleotides are numerical artifacts of the Fourier transform caused by the length of DNA strands, which are about 145 nucleotides long.

